Use Benchmarking to see how your salon compares
The Simple Salon Benchmarking shows you how your business is going compared to other salons of your size. There’s nothing quite like a spot of healthy competition to keep your business on its toes.
Use Benchmarking to see how your salon compares
The Simple Salon Benchmarking shows you how your business is going compared to other salons of your size. There’s nothing quite like a spot of healthy competition to keep your business on its toes.
Set realistic performance expectations and identify areas of opportunity
The Simple Salon Benchmarking tracks and records performance facts to ensure you know exactly where your business stands compared to other salons of your team size. It gives you the knowledge needed to implement fresh strategies and set in motion effective marketing to make your business more profitable. Your growth potential increases when you are equipped with the facts about your business.
Benchmarking is found under the Simple Salon Reporting section. Use the drop-down menu to select your desired date range —This Week, Last Week, This Month or Last Month.
The yellow line represents your salon’s figures and the blue line represents the benchmark which is the average across salons of your team size.
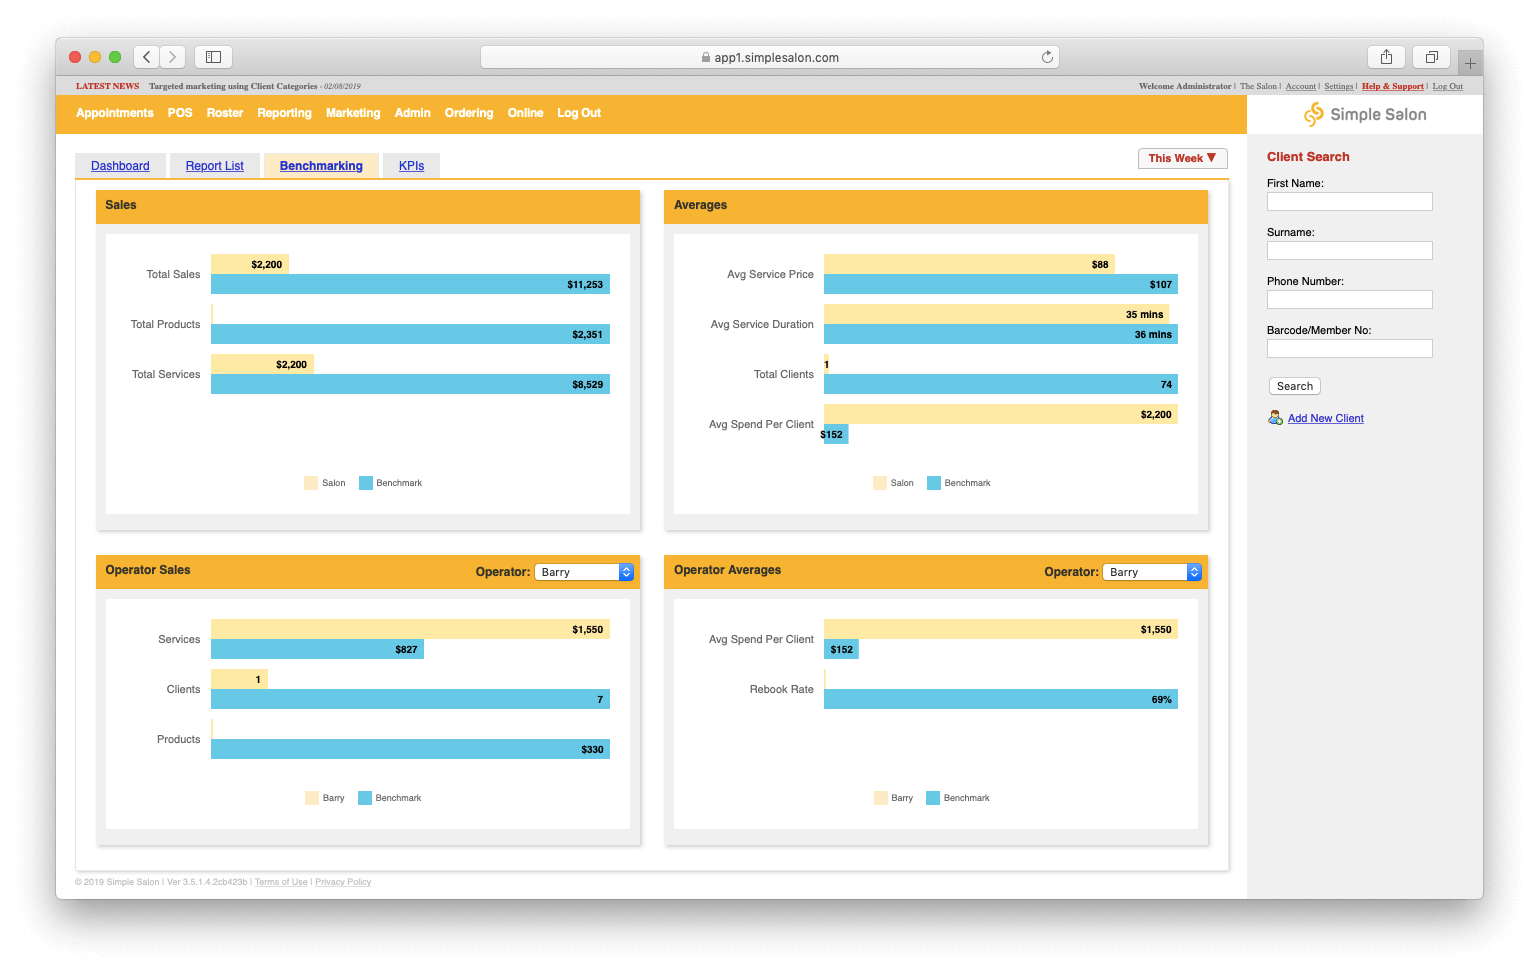
Sales
The Sales box displays your salon’s total sales figures, along with a breakdown of product revenue and service revenue and compares the figures to the benchmark average.
Operator Sales
The Operators Sales box outlines each of your operators’ service sales, product sales and the number of clients they’ve seen compared to the benchmark average.
Averages
The Averages box outlines how your service price, service duration, number of clients and average client spend compares to the benchmark average.
Operators Average
The Operators Average box shows you how each operators’ average client spend and rebook rate compares to the benchmark average.